
This project culminates in an interactive Power BI dashboard suite built on the integrated SQL data model. Each dashboard visualizes retail insights derived from the analyzed dataset in PostgreSQL.

This project showcases the ability to transform raw entertainment data into meaningful insights.
It reflects real-world data analyst tasks — cleaning messy datasets, extracting features, identifying trends, and presenting findings through clear visualizations.
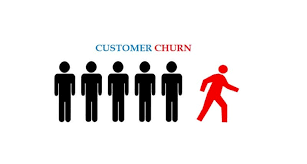
Bank churn directly impacts profitability. I engineered features, built predictive models, and visualized churn drivers in MS Excel. The model can guide retention campaigns and improve ROI.

This project extracts data from the Wikipedia page “List of largest companies in the United States by revenue” and saves it as a structured CSV file for analysis.

An interactive Business Intelligence solution designed to track retail performance across regions, categories, and time. This dashboard transforms raw transactional data into actionable insights, allowing stakeholders to identify high-value products and regional growth opportunities at a glance.